This week, I worked with an exciting algorithm that is K-means. Of course, it won’t be exciting if you don’t know why and how it is used for. During my undergraduate, I did read about this but never used it until now. This algorithm is really helpful in solving the sales beat problem.
What is clustering?
Clustering is an unsupervised machine learning technique that groups similar data points or objects together based on their characteristics or attributes. The main goal of clustering is to find natural groupings or patterns within a dataset.
With the help of k means, you can group the locations based on latitude and longitude. By grouping the locations, it will be easier for you to allocate sales people to visit your customers. Ofcourse this is a very tough problem to solve, but simple and direct problems can be definitely solved with the K-means algorithm.
The code to visualise the clustering:
import numpy as np
import matplotlib.pyplot as plt
from sklearn.datasets import make_blobs
from sklearn.cluster import KMeans
n_samples = 300
n_clusters = 4
X, y_true = make_blobs(n_samples = n_samples, centers = n_clusters, cluster_std = 0.60, random_state = 0)
kmeans = KMeans(n_clusters = n_clusters)
kmeans.fit(X)
y_kmeans = kmeans.predict(X)
plt.figure(figsize = (8,6))
plt.scatter(X[:, 0], X[:, 1], c = y_kmeans, s = 50, cmap = 'viridis')
centers = kmeans.cluster_centers_
plt.scatter(centers[:, 0], centers[:, 1], c='red', s=200, alpha=0.75, marker='X', label='Centroids')
plt.title('K-means Clustering')
plt.xlabel('Feature 1')
plt.ylabel('Feature 2')
plt.legend()
plt.grid()
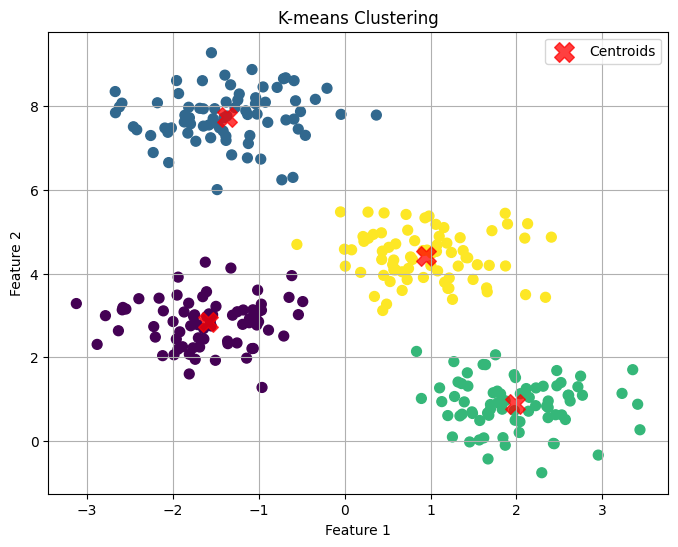
plt.show()
Below is the output of the k means algorithm
Now, you need to make use of the above data, then you can get the output of the clustered data in a csv file.
# Import necessary libraries
import numpy as np
import pandas as pd
from sklearn.datasets import make_blobs
from sklearn.cluster import KMeans

# Generate synthetic data
n_samples = 300
n_clusters = 4
X, _ = make_blobs(n_samples=n_samples, centers=n_clusters, cluster_std=0.60, random_state=0)

# Apply K-means clustering
kmeans = KMeans(n_clusters=n_clusters, random_state=0)
kmeans.fit(X)
y_kmeans = kmeans.predict(X)

# Create a DataFrame to store the data and labels
df = pd.DataFrame(X, columns=['Feature 1', 'Feature 2'])
df['Cluster Label'] = y_kmeans

# Write the DataFrame to a CSV file
csv_file_path = 'kmeans_clusters.csv'
df.to_csv(csv_file_path, index=False)

print(f"K-means clustering results saved to {csv_file_path}")
There are many other applications where you can use k means algorithm, but here this was just the one use case where I have used it.